I started my research by looking at static info graphics so I could focus on the design of the components and how the statistics can be presented differently. I've found that the colours used don't vary too much and are generally quite neutral and aren't harsh on the eyes by being too bright.

Gaming is Good for You - Frugal Dad (snippets selected)

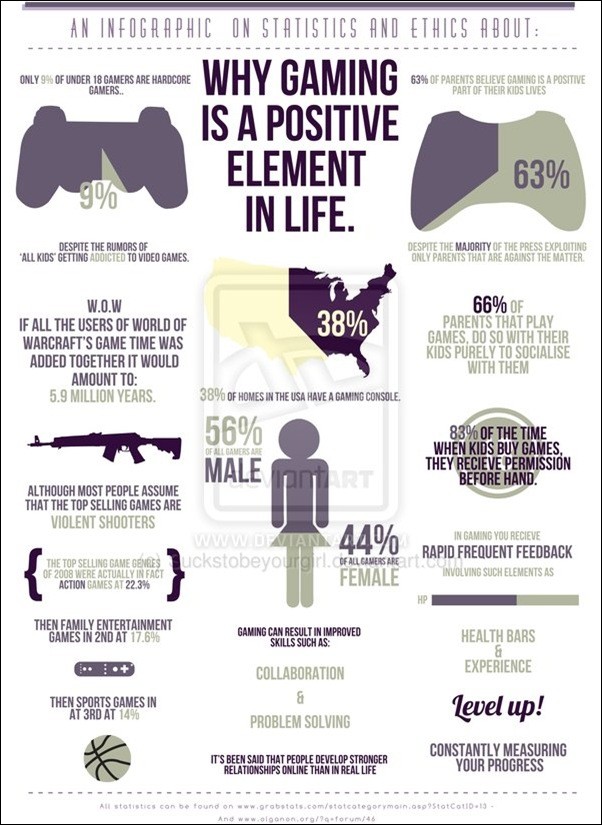
Gaming Info-graphics

Infographic of Infographics
My next port of call was to look at how these elements could be animated.
Travel Infographic - YoCreative
I really liked this info graphic by Yocreative. Though it's not exactly what I was looking for as it doesn't present data, I like the consistency of the animation. I think this is what I'm going to strive for with my own animation; A consistent animation that doesn't go overboard, instead uses simple imagery and movements to get a point across.
The Infographics Show
The Infographics Show is a channel on YouTube that is dedicated to producing infographics. I chose to look at this one in particular because of how it tackled the data, but I shall be referring to their videos as a reference for how I could potentially animate my own.
No comments:
Post a Comment